What actually moves crime?
Now you can prove it.
Using the same causal-inference methods used in peer-reviewed criminology research, we tested three of the biggest levers a department can pull — patrol stops, response times, and search practices — against a full year of real 2025 Nashville stop, crime, and dispatch data. Here's what actually moves the numbers, and what doesn't.
Explore Demos
Academic-Grade.
Not black box AI.
Most analytics platforms find patterns. Sigma Squared finds drivers — the specific factors that don't just correlate with success but actually produce it.
Every model is deterministic, causal, and explainable on demand. The same inputs produce the same outputs every time. When someone asks why, the system answers.
Explainable on demand.



Crime Inflection Intelligence
Find out exactly when your department's crime trend shifted — and whether it's a story unique to you or part of something bigger. We benchmark your numbers against a synthetic control built from comparable departments.
How do you stack up against peer cities?
Go to the Peer Benchmarking Demo

Does response time affect crime?
See exactly how much every minute of response time is costing your department in crime — and whether more visible patrols could be tightening it.
Every minute is measurable.
Go to the Response Time Demo

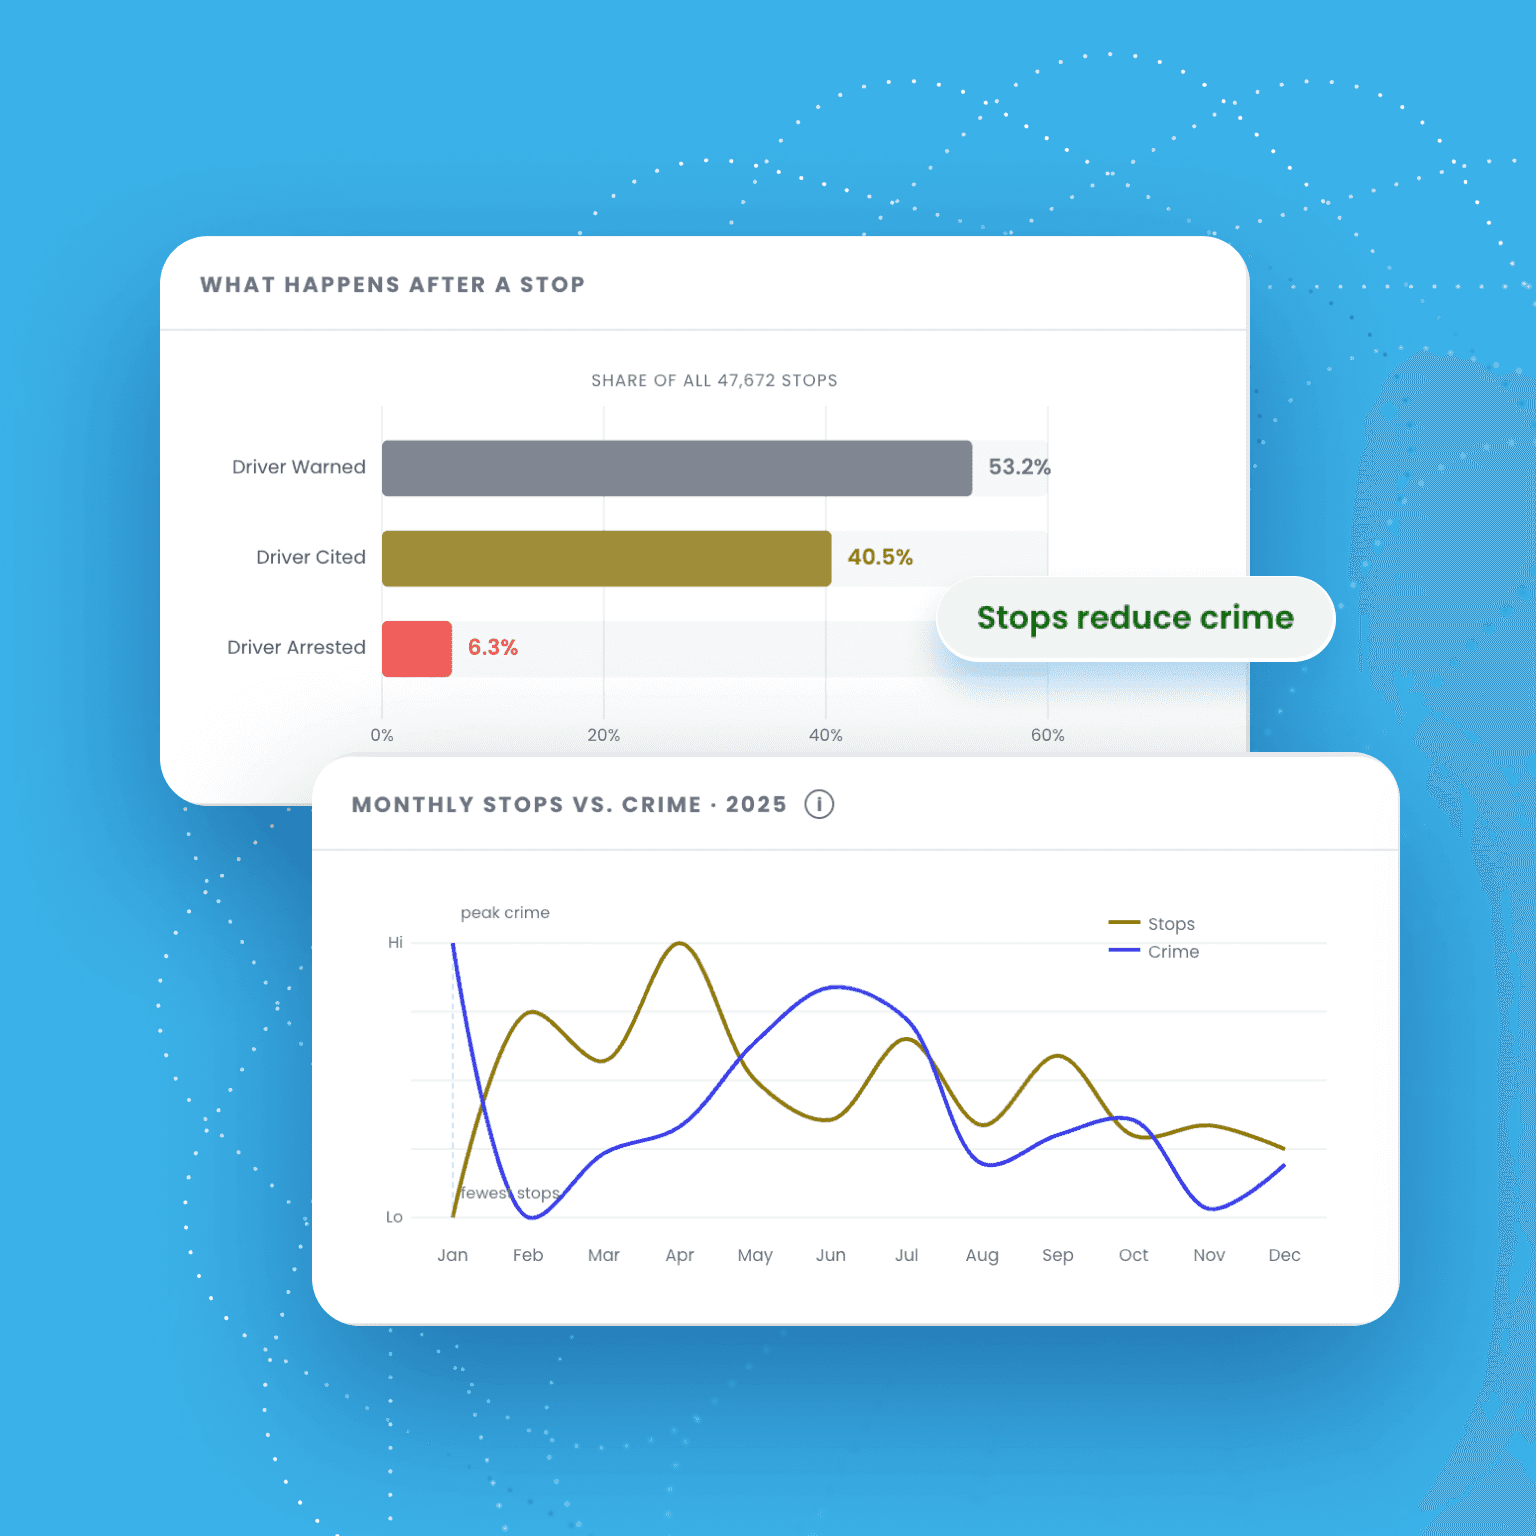
Do stops reduce crime?
Find out whether your patrol strategy is actually deterring crime — not just chasing it after the fact.
Patrol presence, tested.
Go to the Stops & Crime Demo